Learn about Socially Responsible Investing
Contact Frankly Financial for Retirement and Insurance Planning Assistance


It isn't how much you make
. . .It's how much you keep!

  • Home
  • About
  • Financial Planning
    • Overcoming Retirement Challenges
    • IRA Roll-Over Benefits
    • Saving for College Takes Careful Planning
  • Insurance
    • Guaranteed Investment Stream
    • Long-Term Health Care Insurance
  • Coming Events
  • My Blog
  • My Newsletters
  • Contact Frank

Archive for Investments – Page 5

Socially Responsible Investing: Aligning Your Money with Your Values

Posted by Frank McKinley on
 December 31, 2019

Sustainable, responsible, and impact (SRI) investing (also called socially responsible investing) has been around for a long time, but growing interest has moved it into the mainstream. U.S. SRI assets reached $12 trillion in 2018, 38% more than in 2016. SRI investments now account for about one-fourth of all professionally managed U.S. assets.1

Surveys suggest that many people want their investment dollars to have a positive impact on society.2 Of course, personal values are subjective, and investors may have very different beliefs and priorities.

But there is also a wider recognition that some harmful business practices can affect a corporation’s bottom line and its longer-term prospects. In some instances, good corporate citizenship may boost a company’s public image and help create value, whereas shortsighted actions taken to cut costs could cause more expensive damage in the future.

Data-driven decisions

Services that provide research and ratings for investment analysis may also verify and publish environmental, social, and governance (ESG) data associated with publicly traded companies. Money managers who use SRI strategies often integrate ESG factors with traditional financial analysis. Some examples of ESG issues include environmental practices, employee relations, human rights, product safety and utility, and respect for human rights.

For example, an SRI approach might include companies with positive ESG ratings while screening out companies that raise red flags by creating a high level of carbon emissions, engaging in questionable employment practices, investing in countries with poor human rights records, or profiting from certain products or services (e.g., tobacco, alcohol, gambling, weapons).

Some investors may not want to avoid entire industries. As an alternative, they could use ESG data to compare how businesses in the same industry have adapted to meet social and environmental challenges, and to gain some insight into which companies may be exposed to risks or have a competitive advantage.

Contact Frank if you would you like more information on socially responsible investing.

Investment vehicles

Many SRI mutual funds and exchange-traded funds (ETFs) are broad based and diversified, some are actively managed, and others track a particular index with its own universe of SRI stocks.

Specialty funds, however, may focus on a narrower theme such as clean energy; they can be more volatile and carry additional risks that may not be suitable for all investors. It’s important to keep in mind that different SRI funds may focus on very different ESG criteria, and there is no guarantee that an SRI fund will achieve its objectives.

The number of mutual funds and ETFs incorporating ESG factors has grown rapidly from 323 in 2012 to 705 in 2018.3 As the universe of SRI investments continues to expand, so does the opportunity to build a portfolio that aligns with your personal values as well as your asset allocation, risk tolerance, and time horizon.

As with all stock investments, the return and principal value of SRI stocks and investment funds fluctuate with changes in market conditions. Shares, when sold, may be worth more or less than their original cost. Asset allocation and diversification do not guarantee a profit or protect against investment loss.

Investment funds are sold by prospectus. Please consider the investment objectives, risks, charges, and expenses carefully before investing. The prospectus, which contains this and other information about the investment company, can be obtained from your financial professional. Be sure to read the prospectus carefully before deciding whether to invest.

1-3US SIF Foundation, 2018


Categories : Blog, Investing, Investments, socially responsible investing

What Just Happened?

Posted by Frank McKinley on
 February 22, 2018

A massive amount of automated trading helped cause recent turmoil in the market.Frankly Financial can help you make sense of todays very volitale market conditions

When the Fed began to reverse QE and started QT (tightening), it began to reverse its short volatility position in the bond market, which also affects stock market volatility.

Record inflows into stocks

January, typically a strong month because of the long term tendency for pension funds and institutional money to enter the market. This year was no different, as equity funds enjoyed their biggest monthly inflows on record, attracting about $102.6 billion in January.  This caused the stock market to post its best January returns since 1987.

Computers and leverage

The recent decline was driven by computers trading with other computers on high amounts of leverage. High frequency trading (HFT) routinely surpasses 50% of volume on most stock exchanges, and it may have made up more than 50% of recent volume.  The 1987 market crash was blamed on “portfolio insurance,” a form of computerized trading in which the lower the stock market went, the more the computer programs sold, creating a quick avalanche effect. Some of the recent moves felt like small avalanches.

The effect of (short) volatility ETFs especially ETPs

The Energy Transfer Partners (ETPs) space is over $3 trillion. As that space has grown, so has the use of computerized trading that helps manage ETP securities.  Suffice it to say stock market volatility explosions caused those ETPs to reverse their short VIX futures positions, causing a record surge in VIX futures buy orders after-hours, when such ETPs typically square their positions.

On the day the Dow Jones Industrial Average declined 1,175 points, a surge in VIX futures buy orders created a surge in S&P futures sell orders as they are inversely correlated. Because of the record buying of VIX futures, their prices rose quickly after-hours, which caused many ETPs whose portfolios are short VIX futures to suffer record 80% declines after-hours, in effect blowing up their portfolios.

While most of the assets in short-volatility ETFs have already been liquidated over the week ending Feb. 9, there are still over $3 trillion in assets in all ETPs, so, sorry to say that further downside is still lurking in the stock market. It looks like the regulators allowed a monster to grow in the face of the ETP industry and they will have a very difficult time reining it in.

While this latest avalanche effect may have been triggered by the air pocket of inflows in stocks in February catalyzed by spiking long-term interest rates and imploding short-volatility ETPs, there is likely to be more volatility for the rest of 2018.  The Fed is slated to keep reversing its own “short volatility” position in the bond market by intensifying QT operations, so the roller coaster we experienced in January and February may repeat – more than once.  (Source: MarketWatch, Feb. 14, 2018)

CALL ME for a portfolio review at no charge or obligation.

Just don’t wait too long…

Categories : Bonds, Financial Services, Investing, Investments, Stocks

Average Investor vs the Market

Posted by Frank McKinley on
 February 14, 2018

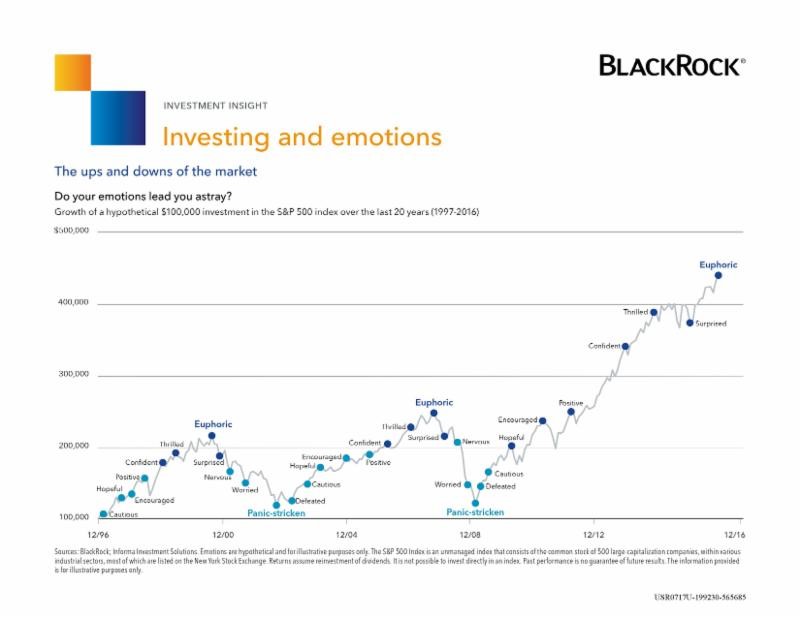
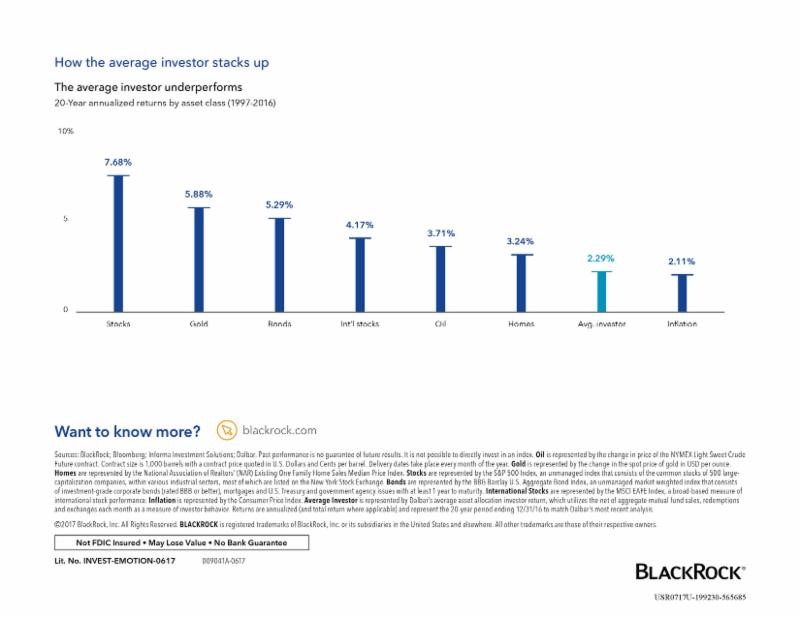
Do you know how the market has behaved over the last 20 years? How have you managed your investments over that time? Do you see any kind of pattern? Does this chart from BlackRock mean anything to you? Bear in mind, it stops at the end of 2016 and the S&P has increased nearly another 20% since then, so it’s even higher than the chart shows!
BlackRock Investing vs Emotions Graph

How the average investor stacks up

Click here to view PDF version

CALL ME for a portfolio review at no charge or obligation.
Just don’t wait too long…

Graph and information provided by BlackRock
Categories : Financial Services, Investing, Investments, Stocks

Don’t Take It From Me

Posted by Frank McKinley on
 January 23, 2018
Dont take it from me - 2018-01-02 Newsletter
Categories : Blog, Financial Services, Investing, Investments, IRA

December 2016

Posted by Frank McKinley on
 December 9, 2016
December 2016
Categories : Investing, Investments, Newsletters

November 2016

Posted by Frank McKinley on
 November 1, 2016
November 2016
Categories : Investing, Investments, Newsletters
← Previous Page
Next Page →

Recent Newsletters & Blogs

  • And you think you have it bad…
  • Winter, BRRR…
  • U.S. Elections Spark Global Financial Uncertainty
  • THE ELECTION IS HEATING UP!
  • 3 Mistakes Investors Make During Election Years

Archives


Categories

  • 529 Savings Plans
  • Blog
  • Bonds
  • College Savings
  • Contributions
  • Credit Card Debt
  • estate planning
  • financial planning
  • Financial Services
  • Insurance
  • Investing
  • Investments
  • IRA
  • Life Insurance
  • Long-term Care
  • Medicaid
  • Medicare
  • Newsletters
  • Paycheck Protection Program
  • rebate payments
  • Retirement
  • ROTH
  • Savings
  • Savings Goals
  • Security
  • Social Security
  • socially responsible investing
  • Stocks
  • Tax
  • The CARES Act
  • the SECURE ACT
  • unemployment benefits
  • Wills
Frankly Financial | Copyright © 2014. All Rights Reserved.
Site Designed by TriDelta Design Group