Learn about Socially Responsible Investing
Contact Frankly Financial for Retirement and Insurance Planning Assistance


It isn't how much you make
. . .It's how much you keep!

  • Home
  • About
  • Financial Planning
    • Overcoming Retirement Challenges
    • IRA Roll-Over Benefits
    • Saving for College Takes Careful Planning
  • Insurance
    • Guaranteed Investment Stream
    • Long-Term Health Care Insurance
  • Coming Events
  • My Blog
  • My Newsletters
  • Contact Frank

Archive for Stocks – Page 2

Watching Your Stocks

Posted by Frank McKinley on
 October 20, 2020

No matter how often you prefer to monitor your stocks’ performance, there are certain items you should consider. Here are five things to review as you monitor your stocks’  performance:

Earnings — Pay attention to the company’s  quarterly and annual earnings statements, which include comparisons with the recent past and often reviews of what management expects for the next quarter and year. Review the stock’s earnings trend and how the company performs compared to analysts’ estimates. Watch out for earnings surprises, which can cause rapid price changes up or down, and may indicate the start of a new stock price trend.

Price and dividends — Follow
the stock’s price compared to its
52-week highs and lows. Examine its trailing total returns year to date and over the last one-, three-, five-, and 10-year periods. Look for changes in the absolute dollar amount of dividends and the current yield (the annual dividend divided by the current price).

P/E and PEG ratios — Price to earnings (P/E) and price/earnings growth (PEG) ratios are often better indicators than the stock price as to how relatively expensive or cheap a stock is.

The P/E ratio is useful for comparison to other stocks and the market, while the PEG ratio is a strong indicator of whether the stock is overpriced or underpriced compared to its projected earnings growth rate over the next five years.

Insider transactions and stock
buybacks
— A company buying
back its own stock or whose senior
executives and directors are accumulating more shares is a bullish sign.
On the other hand, when insiders are selling off major holdings of their own stock, it’s quite often an indication that the stock price has peaked.

Sudden and large price changes
on high volume
— When a stock
makes a sudden, high-volume move
— particularly when it opens much
higher or lower than the previous day’s high or low — it can be the start of a new, long-term trend.

For help monitoring your stocks’ performance, or if you need to make a change to your investment portfolio, please call.

Dividend Investing

Dividend investing creates both an income stream from dividends as well as portfolio growth from asset appreciation.

The first thing dividend investors look for is safety, which is measured by the dividend coverage ratio. Typically, dividend investors
don’t want to see companies pay out more than 60% of their profits as dividends to investors to ensure the company has the resources for operations. Dividend investors look for companies that have good cash flow and stable income, because they can get a higher payout ratio and don’t have to worry about the company’s ability to pay the dividend.

When an investor follows the high dividend yield strategy, he/she is investing in companies with yields at the top of the range that will provide a predictable income stream. Investors who focus on a high dividend growth strategy are investing in companies whose dividend payments are significantly lower than average, but the company is growing at a very fast rate.

After a period of time, these fast-growing
companies can increase dividends to an equal or much higher level than what would have
been collected using the high dividend yield approach.

Financial Thoughts

In a recent survey, 9% of non-retiree respondents said that they knew for certain what their Social Security benefits would be, 41% had a guess or estimate, and 49% had no idea how much their benefits would be (Source: AAII Journal, March 2020).

A recent study found that individuals with children have 10% less wealth by retirement age than individuals without children. However, individuals with children were

just as satisfied with retirement as those without children. One of the reasons for this
difference is that retirement saving goals differ in meaningful ways between the two groups.  (Source: American Enterprise
Institute, December 2019).

Consumers worldwide put an average value of $35,000 on digital assets stored on their mobile devices, which includes photos and videos (Source: Journal of Financial Planning, April 2020).

About 81% of U.S. adults age 72 and older have a healthcare power of attorney, while only 41% of millennials have one (Source:
AARP, 2020).

Approximately 20% of baby boomers who receive an inheritance of $100,000 or more spend the entire inheritance.  (Source:
Journal of Family and Economic Issues, 2020).

If you would like more information or to discuss your financial concerns

Click Here
Representatives are registered through, and securities are sold through Nationwide Planning Associates, Inc., Member FINRA/SIPC, located at 115 West Century Road, Suite 360, Paramus, NJ 07652. Investment advisory services are offered through NPA Asset Management, LLC. Insurance sold through licensed NPA Insurance Agency, Inc. agents. Frank is registered in NJ, NY, PA, FL, CT, CO, NC, OH and RI. He is also licensed for life and health insurance in NJ, NY, FL, OH and RI. The presence of this web site on the Internet shall in no direct or indirect way be construed or interpreted as a solicitation to sell advisory services to residents of any state other than those listed above and shall not be deemed to be a solicitation of advisory clients living in any state other than those listed above. Nationwide Planning Associates, Inc. and Frankly Financial are non-affiliated entities.
Copyright © 2020. Some articles in this newsletter were prepared by Integrated Concepts, a separate, non-affiliated business entity. This newsletter intends to offer factual and up-to-date information on the subjects discussed but should not be regarded as a complete analysis of these subjects. Professional advisers should be consulted before implementing any options presented. No party assumes liability for any loss or damage resulting from errors or omissions or reliance on or use of this material.

Categories : Financial Services, Investing, Investments, Stocks

New to Investing? Avoid These Mistales

Posted by Frank McKinley on
 October 13, 2020

I f you are new to investing, there is no doubt that you will make some mistakes; it just goes with the territory. However, you should familiarize yourself with these common mistakes and take steps to avoid them.

No Investment Plan — Many investors just get started in the stock market without giving any thought as to what they are trying to accomplish. It is important to have a plan that will keep you on track and help you ride out turbulent markets. Your plan should include:

Goals — Define what you are
trying to accomplish so you
can measure your portfolio’s performance in meeting your goals. You will want to be as specific as possible,
such as accumulating $1 million for retirement by age 60 or $100,000 for your child’s  education within 15 years.

Risk Tolerance — Define how much risk you are comfortable with so you can determine an appropriate allocation for your assets. Stocks are riskier than bonds and will fluctuate more than other asset classes, so you want to figure out how much risk you are willing to assume. The younger you are, the more risk you can typically assume,

Carefully determine your risk tolerance

since you have more time to overcome any declines in your investments.

Asset Allocation — You will want to determine how to allocate your assets across different investments, such as stocks, bonds, etc.

Diversification — Once you determine your asset allocation, you will want to diversify within each individual asset class. For example, when investing in stocks, you will want to spread your funds across large-, mid-, and smallcap stocks.

Time Horizon — Don’t wait too long to start investing because time is your friend. If you
are saving for retirement, plan on 30 years of investing to meet your goals. If you don’t allocate enough time to meet a specific goal, you will need to adjust your asset allocation
to help you meet the goal within a shorter timeframe. For example, if you start saving for a child’s college education when he/she is a
freshman in high school, your assets will most likely need to be allocated more heavily to stocks in an attempt to meet that timeframe.

Stop the Noise — Be careful
with how much time you spend and
the credence you lend to the financial
media. Media noise can be hard
to turn off, but remember the best
advice is to stick to your plan.

Not Rebalancing — You will want to review your portfolio regularly and rebalance if it strays from your target asset allocation. When
you allow your portfolio to drift based on market returns, some asset classes will be overweighted at market peaks and  underweighted at market lows, which may lead to poor performance. While it will sometimes feel counterintuitive to sell assets that are performing well for those that are not performing as well, your target asset allocation
will lead to a stronger performance in the long term.

chasing performance as the single factor for a stock purchaseChasing Performance — Many investors are always trying to find the next big investment. They will rely on recent strong performance
as the single factor in purchasing an investment. If a certain stock has been doing extremely well for a number of years, you should probably have invested in it years ago,
since it may be nearing the end of its high performing cycle.

When an investment is doing extremely well, many people will not sell and take the profit because they are afraid that it will continue
to increase in value. But there is also the risk that it will go down in value.

You should also consider identifying a target value at which you will sell your stocks. This will help take the emotion out of your sell
decisions.

Becoming Too Emotional — It’s hard not to get emotional when the market encounters a severe correction, but the investors who have
the ability to remain calm during these times more consistently outperform the market. If you start selling off investments at the worst
possible time, you may then be out of the market when it starts to rebound.

While it is easier said than done, you have to build a resistance to those things that create emotional triggers so you don’t make bad
decisions. Thoughtfully consider new information, don’t just follow the crowd, and make decisions when you are calm based on your long-term plan.

If you would like more information or to discuss this in more detail

Click Here
Representatives are registered through, and securities are sold through Nationwide Planning Associates, Inc., Member FINRA/SIPC, located at 115 West Century Road, Suite 360, Paramus, NJ 07652. Investment advisory services are offered through NPA Asset Management, LLC. Insurance sold through licensed NPA Insurance Agency, Inc. agents. Frank is registered in NJ, NY, PA, FL, CT, CO, NC, OH and RI. He is also licensed for life and health insurance in NJ, NY, FL, OH and RI. The presence of this web site on the Internet shall in no direct or indirect way be construed or interpreted as a solicitation to sell advisory services to residents of any state other than those listed above and shall not be deemed to be a solicitation of advisory clients living in any state other than those listed above. Nationwide Planning Associates, Inc. and Frankly Financial are non-affiliated entities.
Copyright © 2020. Some articles in this newsletter were prepared by Integrated Concepts, a separate, non-affiliated business entity. This newsletter intends to offer factual and up-to-date information on the subjects discussed but should not be regarded as a complete analysis of these subjects. Professional advisers should be consulted before implementing any options presented. No party assumes liability for any loss or damage resulting from errors or omissions or reliance on or use of this material.
Categories : Bonds, Financial Services, Investing, Investments, Stocks

The Truth About Presidential Elections

Posted by Frank McKinley on
 September 16, 2020

Politics and investing have always been spoken about in the same breath. Commentators and candidates alike often frame the performance of the stock market as a sort of “barometer” of a president’s policies. But the data don’t support this link. Over the past 120 years, the long-term performance of the market has shown almost no correlation with government policies.

So what’s the real story when it comes to politics and investing?

Consider these historical truths:

1. Markets have performed well under both parties

Neither party can lay claim to superior economic or financial market performance. The S&P 500 Index delivered an average annual return of approximately 11% over the past 75 years, through both Democratic and Republican administrations. The US economy also expanded around 3.0% during that period.1

Presidential term stock market return vs. economic growth (1957-present)

markets performed well under both parties

2. Markets don’t care if you don’t approve of the president

From the inauguration of President Kennedy through the current administration of President Trump, some of the best returns in the stock market have come when the president’s approval rating was between 36% and 50% — in other words, when at least half the country disapproved of the job performance of the sitting president.2

Gallup poll presidential approval ratings and the growth of $100,000

markets don't care if your don't approve of the president

3. Signature legislation often doesn’t impact the economy as expected

Predictions about the ultimate impact of legislation are often far removed from the actual results. For instance, it was predicted that President Obama’s Patient Protection and Affordable Care Act of 2010 would destroy small-business hiring. But since it was implemented, 8.6 million jobs have been added in this sector.3 Similarly, President Trump’s Tax Cut and Jobs Act of 2017 was intended to unlock capital expenditures, but it has thus far failed to bring an acceleration in business investment as issues such as trade uncertainty and, most recently, Coronavirus have impacted confidence.

Example 1: Patient Protection and Affordable Care Act

Employers with 50 or more full-time employees are considered “large business” and therefore required to offer employee health coverage or pay a penalty.

Non-farm private medium payroll employment (50-499)

Signature legislation often has no impact on the economy

Example 2: Tax Cuts and Jobs Act of 2017

Section 179 allows taxpayers to deduct the cost of certain property (such as machinery and equipment purchased for use in trade or business) as an expense when property is placed in service.

US capital goods new orders (nondefense ex-aircraft and parts)

tax cuts and job acts of 2017

Learn more about what really matters to markets

These are just some of the essential truths about elections and investing. Click here to see a brochure which clearly and simply illustrates these three, plus seven more:

  • Investors are better off staying fully invested.
  • We do not radically re-engineer the US economy.
  • The historical narrative is not as you remember it.
  • Predictions tend to be wrong.
  • Monetary policy matters more.
  • No, this is not the most vitriolic election.
  • Don’t confuse partisan politics with market analysis

1. Haver, Invesco, 6/30/20. Note: President Trump stock market performance data from 1/20/17-6/30/20., real GDP data from 12/31/2016 to 3/31/2020 as GDP is reported with a lag. Stock market performance is defined by the total return of the S&P 500 Index.
2. Bloomberg, L.P., 6/30/20. An investment cannot be made in an index.
3. Bloomberg, L.P., FRED, 3/31/20. Most recent data available.
See Index definitions on page 13 of the brochure.
Past performance does not guarantee future results

MY JOB IS TO BE HERE WHEN THINGS ARE BAD!

If you would like more information or to discuss your financial concerns

Click Here
Representatives are registered through, and securities are sold through Nationwide Planning Associates, Inc., Member FINRA/SIPC, located at 115 West Century Road, Suite 360, Paramus, NJ 07652. Investment advisory services are offered through NPA Asset Management, LLC. Insurance sold through licensed NPA Insurance Agency, Inc. agents. Frank is registered in NJ, NY, PA, FL, CT, CO, NC, OH and RI. He is also licensed for life and health insurance in NJ, NY, FL, OH and RI. The presence of this web site on the Internet shall in no direct or indirect way be construed or interpreted as a solicitation to sell advisory services to residents of any state other than those listed above and shall not be deemed to be a solicitation of advisory clients living in any state other than those listed above. Nationwide Planning Associates, Inc. and Frankly Financial are non-affiliated entities.
Copyright © 2020. Some articles in this newsletter were prepared by Integrated Concepts, a separate, non-affiliated business entity. This newsletter intends to offer factual and up-to-date information on the subjects discussed but should not be regarded as a complete analysis of these subjects. Professional advisers should be consulted before implementing any options presented. No party assumes liability for any loss or damage resulting from errors or omissions or reliance on or use of this material.

Categories : Blog, Financial Services, Investing, Investments, Stocks

When Stocks Drop That’s NOT The Problem

Posted by Frank McKinley on
 May 19, 2020

Sometimes, when it comes to investing, volatile markets aren’t your worse enemy. You are.  Unfortunately, our brains often play tricks on us, causing even the savviest of investors to make decisions that don’t really make a lot of sense, such as panic selling or ignoring opportunities.

The problem of psychological investing traps is so pervasive, in fact, that there’s a whole field dedicated to studying it called behavioral finance. Researchers in this discipline look at the way psychology affects how we make financial decisions. Knowing about these traps can help you avoid them and make you a better investor. Here are seven psychological traps to keep in
mind.

Sunk Costs Bias — The sunk costs bias has to do with the all-too common tendency to stick with
something, whether a bad boyfriend or a bad investment, long after it’s clear that it’s not worth it anymore. Still, because you’ve invested a certain
amount of time or money, you’re reluctant to give it up. In investing, you might end up hanging on to a stock long after you should sell it in the vain hope that you’ll eventually come out ahead. But in
these cases, it’s better to cut your losses rather than to hang on to a loser.

Familiarity Bias — Most of us are biased toward what is familiar to us. We head to restaurants we’ve been to before and follow the same roads to work because we know what to expect. With  investing, familiarity bias involves favoring investments that are familiar to you. You might prefer to invest in the company you work for or big-name businesses that are in the news. That
could cause you to overlook important opportunities you don’t know as much about.

Anchoring — Anchoring is the process of getting attached to a particular reference point – such as the price you paid for a stock — and using that to guide future decisions. Or you might fixate on a stock’s previous high, even though that price was an anomaly. Anchoring is why buyers think they got a great deal when buying a car for $50,000 when the initial price was $60,000, even though the car’s really worth $40,000.

Whether buying stocks or cars, anchoring involves using a single piece of information to determine what a stock or other investment
should be worth while also discounting more relevant information, such as a company’s fundamentals or broader economic trends. Unfortunately, avoiding anchoring is difficult,
but considering all available information before choosing an investment can help.

Focusing Too Much on the Recent Past —  Recency bias is the tendency to make decisions or judgments based on relatively new or recent information. For example, during times when the market is up, people may ignore or discount the
possibility of a market decline. Or, if a certain category of stocks has done poorly recently, people may conclude that those stocks always have negative returns, even if the dip is an anomaly. You can avoid this mistake by doing your best to consider the entire universe of information at your fingertips, not just what happened yesterday.

Following the Herd – While following trends might be fine for fashionistas, it’s not always a smart investing move. Yet herd investing

is an all-too-easy trap to fall into. If everyone is telling you that now’s the time to get into a certain hot investment, you may feel you need to act fast so you don’t miss out. But just because something is popular doesn’t make it a good investment. Blindly following the herd without first consulting your own financial goals and plan doesn’t make you a smart investor.

Overconfidence — Most of us like to think we’re smarter than the average person. If you hit it big
with a certain investment, you may over-attribute that success to your skill rather than what it really is — luck. That can cause you to repeat
the same behavior again.

Panic — Investing isn’t for the faint of heart. When the market takes a sudden dip, it’s easy to
panic, which can lead you to make bad decisions, such as selling at a big loss, rather than riding out the natural hills and valleys of investing.
Making these emotionally driven choices costs you a lot of money. When making investing decisions,  make sure they’re based on evidence, not your initial gut reaction to the day’s events.
Avoiding psychological investing traps on your own can be difficult. 

phychological traps when watching the stock market

Please call me at 973-515-5184 or contact me
if you’d like to discuss this in more detail.

Click here to view our latest newsletter.

Copyright © 2020. Some articles in this newsletter were prepared by Integrated Concepts, a separate, non-affiliated business entity. This newsletter intends to offer factual and up-to-date information on the subjects discussed but should not be regarded as a complete analysis of these subjects. Professional advisers should be consulted before implementing any options presented. No party assumes liability for any loss or damage resulting from errors or omissions or reliance on or use of this material.

Categories : Blog, financial planning, Financial Services, Investments, Stocks

What Just Happened?

Posted by Frank McKinley on
 February 22, 2018

A massive amount of automated trading helped cause recent turmoil in the market.Frankly Financial can help you make sense of todays very volitale market conditions

When the Fed began to reverse QE and started QT (tightening), it began to reverse its short volatility position in the bond market, which also affects stock market volatility.

Record inflows into stocks

January, typically a strong month because of the long term tendency for pension funds and institutional money to enter the market. This year was no different, as equity funds enjoyed their biggest monthly inflows on record, attracting about $102.6 billion in January.  This caused the stock market to post its best January returns since 1987.

Computers and leverage

The recent decline was driven by computers trading with other computers on high amounts of leverage. High frequency trading (HFT) routinely surpasses 50% of volume on most stock exchanges, and it may have made up more than 50% of recent volume.  The 1987 market crash was blamed on “portfolio insurance,” a form of computerized trading in which the lower the stock market went, the more the computer programs sold, creating a quick avalanche effect. Some of the recent moves felt like small avalanches.

The effect of (short) volatility ETFs especially ETPs

The Energy Transfer Partners (ETPs) space is over $3 trillion. As that space has grown, so has the use of computerized trading that helps manage ETP securities.  Suffice it to say stock market volatility explosions caused those ETPs to reverse their short VIX futures positions, causing a record surge in VIX futures buy orders after-hours, when such ETPs typically square their positions.

On the day the Dow Jones Industrial Average declined 1,175 points, a surge in VIX futures buy orders created a surge in S&P futures sell orders as they are inversely correlated. Because of the record buying of VIX futures, their prices rose quickly after-hours, which caused many ETPs whose portfolios are short VIX futures to suffer record 80% declines after-hours, in effect blowing up their portfolios.

While most of the assets in short-volatility ETFs have already been liquidated over the week ending Feb. 9, there are still over $3 trillion in assets in all ETPs, so, sorry to say that further downside is still lurking in the stock market. It looks like the regulators allowed a monster to grow in the face of the ETP industry and they will have a very difficult time reining it in.

While this latest avalanche effect may have been triggered by the air pocket of inflows in stocks in February catalyzed by spiking long-term interest rates and imploding short-volatility ETPs, there is likely to be more volatility for the rest of 2018.  The Fed is slated to keep reversing its own “short volatility” position in the bond market by intensifying QT operations, so the roller coaster we experienced in January and February may repeat – more than once.  (Source: MarketWatch, Feb. 14, 2018)

CALL ME for a portfolio review at no charge or obligation.

Just don’t wait too long…

Categories : Bonds, Financial Services, Investing, Investments, Stocks

Average Investor vs the Market

Posted by Frank McKinley on
 February 14, 2018

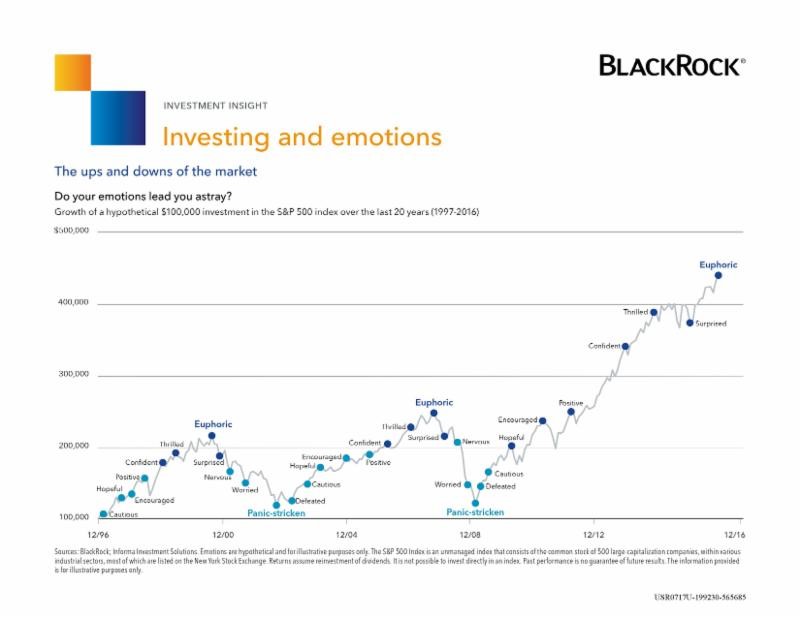
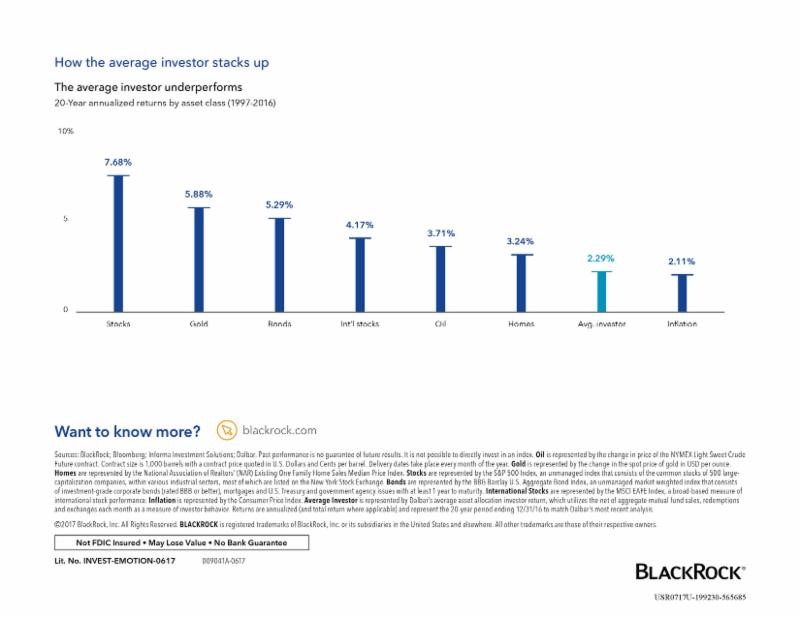
Do you know how the market has behaved over the last 20 years? How have you managed your investments over that time? Do you see any kind of pattern? Does this chart from BlackRock mean anything to you? Bear in mind, it stops at the end of 2016 and the S&P has increased nearly another 20% since then, so it’s even higher than the chart shows!
BlackRock Investing vs Emotions Graph

How the average investor stacks up

Click here to view PDF version

CALL ME for a portfolio review at no charge or obligation.
Just don’t wait too long…

Graph and information provided by BlackRock
Categories : Financial Services, Investing, Investments, Stocks
← Previous Page

Recent Newsletters & Blogs

  • And you think you have it bad…
  • Winter, BRRR…
  • U.S. Elections Spark Global Financial Uncertainty
  • THE ELECTION IS HEATING UP!
  • 3 Mistakes Investors Make During Election Years

Archives


Categories

  • 529 Savings Plans
  • Blog
  • Bonds
  • College Savings
  • Contributions
  • Credit Card Debt
  • estate planning
  • financial planning
  • Financial Services
  • Insurance
  • Investing
  • Investments
  • IRA
  • Life Insurance
  • Long-term Care
  • Medicaid
  • Medicare
  • Newsletters
  • Paycheck Protection Program
  • rebate payments
  • Retirement
  • ROTH
  • Savings
  • Savings Goals
  • Security
  • Social Security
  • socially responsible investing
  • Stocks
  • Tax
  • The CARES Act
  • the SECURE ACT
  • unemployment benefits
  • Wills
Frankly Financial | Copyright © 2014. All Rights Reserved.
Site Designed by TriDelta Design Group